[머신러닝] Support Vector Machine(SVM) 2
Support Vector Machine(SVM)-구현
가장 간단한 방법으로
sklearn을 이용해SVM을 구현한다.
Library
사용한 Library를 열거한다.
import numpy as np
import matplotlib.pyplot as plt
import mglearn  # 랜덤한 데이터셋을 생성하거나 머신러닝 적용 결과를 보기좋기 표현하기 위한 함수들

from sklearn.svm import SVC  # SVM 을 위한 Library, SVC는 Support Vector Classification
from mlxtend.plotting import plot_decision_regions
## 일상적인 데이터 사이언스 작업에 유용한 도구 모임이다.
## 여기서는 SVM에 대한 그림을 그리기 위해 사용한다.
구현
- DataSet 생성
x_data, t_data = mglearn.datasets.make_forge # x의 특징 2가지, y클래스 종류 2가지(0 or 1), 데이터개수 : 26
print(t_data) # [1 0 1 0 0 1 1 0 1 1 1 1 0 0 1 1 1 0 0 1 0 0 0 0 1 0]
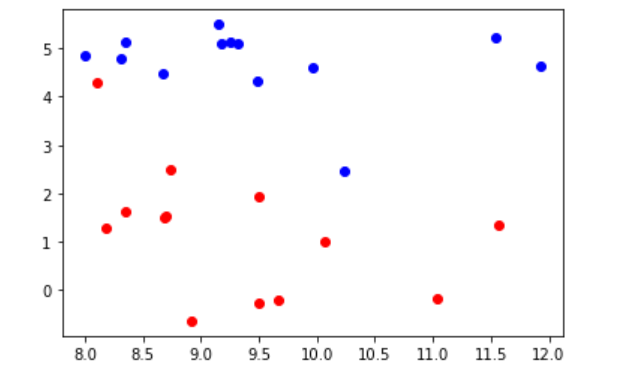
scatter그래프로 확인
r_pt = x_data[t_data==0]
b_pt = x_data[t_data==1]

plt.scatter(r_pt[:,0], r_pt[:,1], color='r')
plt.scatter(b_pt[:,0], b_pt[:,1], color='b')
plt.show()
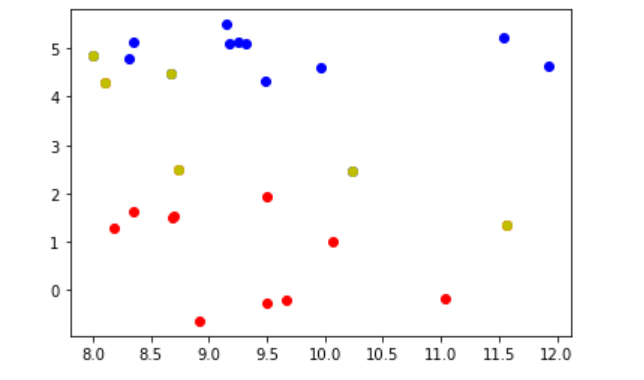
- 학습(linear case)
model = SVC(kernel = 'linear') # linear 외에 'poly' , 'Gaussian kernel'을 사용할 수 있다.
## default 는 Gaussian Kernel
model.fit(x_data, t_data)

plt.scatter(r_pt[:,0], r_pt[:,1], color='r')
plt.scatter(b_pt[:,0], b_pt[:,1], color='b')
plt.scatter(model.support_vectors_[:,0], model.support_vectors_[:,1], color='y')
plt.show()
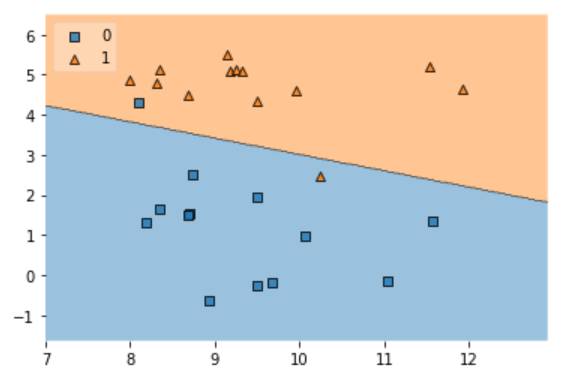
plot_decision_regions을 사용한 그래프
plot_decision_regions(X=x_data, y=t_data, clf=model, legend=2)
plt.show()
## legend : legend 위치
## clf : classification model