Support Vector Machine(SVM)-Hyperparameter
SVM에 있는 대표 hyperparameter 두가지 (C, gamma)에 대해서 알아본다.
C parameter
C parameter는 soft margin parameter C를 나타낸다.
항상 데이터들이 hyperplane 하나로 깔끔하게 나뉘지 않을 수 있다. 그러므로 조금의 잘못 분류된 data들을 허용해 모델을 최적화 시킬필요가 발생한다.
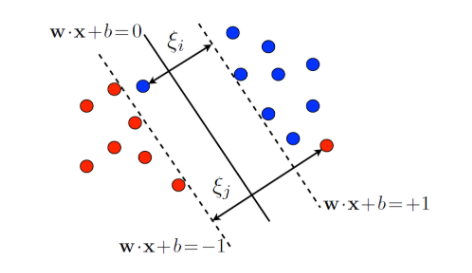
여기서 w·x+b=0 을 우리가 찾는 hyperplane이라고 하면 cost function **또는 **objecitve function 은 다음과 같다.

여기서  는 0 이상의 값으로 slack variable이라고 불리며 벗어난 만큼을 추가해 training errror을 허용한다.
따라서 C는 margin과 training error에 대한 trade-off를 결정하는 tuning parameter이다.
- C ↑ ⇒
 에 대한 제약 ↑ ⇒ training error 를 많이 허용하지 않는다. ⇒ overfitting
 - C ↓ ⇒
 에 대한 제약 ↓ ⇒ training error 를 많이 허용한다. ⇒ underfitting
Gamma parameter
γ pamameter 는 주로 Radial bias kernel을 선택했을 때의 tuning parameter이다.
(kernel의 종류는 크게 linear, polynomial, (gaussian )radial bias function (rbf) kernel이 있다.)
Raidal bias kernel은 다음과 같은 수식을 갖는다.

어떤 그래프인지 확인 해보기 위해 1-dimension이라고 생각하고 z=x-y 라고 두고 그래프를 그려보면 다음과 같다.

γ는 하나의 데이터가 영향력을 행사하는 거리를 결정해 준다.
그래프에서 보듯이,
-
γ↑ ⇒ 각 데이터의 영향력을 행사하는 거리 감소 ⇒ overfitting(decision boundary가 점점 굴곡이 생김)
-
γ↓ ⇒ 각 데이터의 영향력을 행사하는 거리 감소 ⇒ underfitting(decision boundary가 직선에 비슷해짐)
BMI 예제
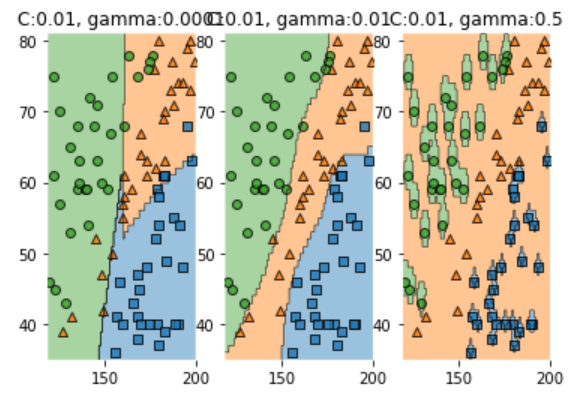
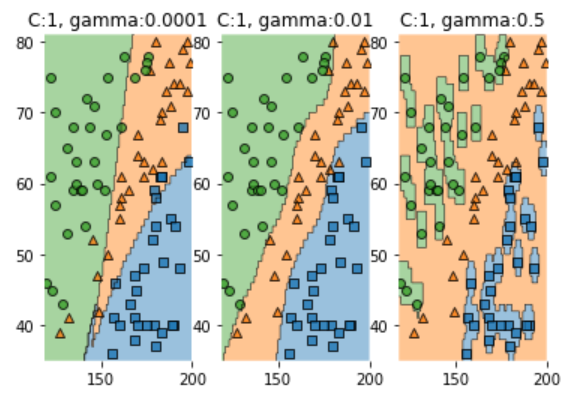
BMI 예제를 통해 C 와 γ에 따라 decision boundary 가 어떻게 변하는지 알아본다.
- libray
import numpy as np
import pandas as pd
import matplotlib.pyplot as plt

from mlxtend.plotting import plot_decision_regions
from sklearn.svm import SVC
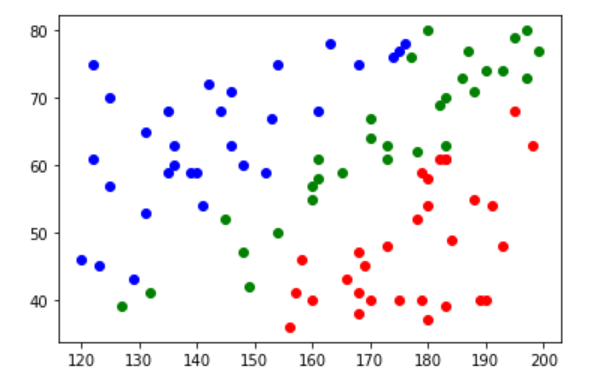
- training data : label 마다 30개의 data를 가져온다.
## training data
df = pd.read_csv('./data/bmi.csv', skiprows=3)
df.head()

num_of_sample = 30

x_data = df.drop('label', axis=1).values
t_data = df['label'].values

x_data_red =  x_data[t_data==0][:num_of_sample]
t_data_red =  t_data[t_data==0][:num_of_sample]

x_data_green = x_data[t_data==1][:num_of_sample]
t_data_green = t_data[t_data==1][:num_of_sample]

x_data_blue = x_data[t_data==2][:num_of_sample]
t_data_blue = t_data[t_data==2][:num_of_sample]
scatter를 이용해 확인
plt.scatter(x_data_red[:,0],x_data_red[:,1], color='r')
plt.scatter(x_data_green[:,0],x_data_green[:,1], color='g')
plt.scatter(x_data_blue[:,0],x_data_blue[:,1], color='b')
plt.show()
- Sample data 정의, model 생성, 그래프로 확인
x_data_sample = np.concatenate([x_data_red, x_data_green, x_data_blue], axis=1)
t_data_sample = np.concatenate([t_data_red, t_data_green, t_data_blue], axis=1)

C_candi = [0.01, 1, 100]
gamma_candi = [0.0001, 0.01, 0.5]

for i in range(3):
    fig = plt.figure()
    for j in range(3):
        model = SVC(C=C_candi[i], gamma=gamma_candi[j]) # kernel의 default는 rbf이다.
        model.fit(x_data_sample, t_data_sample)
        fig.add_subplot(1,3,j+1)
        plot_decision_regions(X=x_data_sample, y=t_data_sample, clf=model, legend=None)
        plt.title('C:{}, gamma:{}'.format(C_candi[i],gamma_candi[j]))
    plt.show()
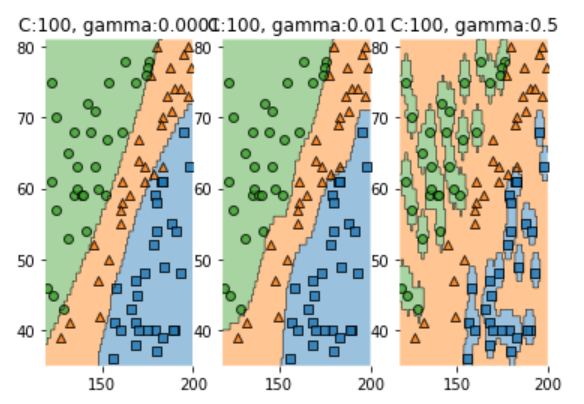
-
분석
-
C : 간단히 분석해 보면 C 값이 커질 수록 분류를 더 잘하는것을 알 수 있다.
위에서도 언급했듯이 C 값이 커질 수록 분류에 대한 training error의 제약이 커지므로 overfitting하게 되는것을 볼 수 있다.
-
gamma : gamma값이 커질 수록 분류를 더 잘하고 overfitting이 발생하는 것을 알 수 있다.
위에서도 말했듯이 gamma값이 커질 수록 각 점의 영향력의 reach는 줄어들기 때문이다.
gamma=0.5인 경우는 영향력의 reach가 매우 작은것을 확인 할 수있다.
-